Author Archive
Tax Newsletter – November 2011
 November 8, 2011 |
  Author
 Business tax losses under Tax Forum spotlight
The treatment of business tax losses will be reviewed by a business tax reform working group announced by the Treasurer at the Tax Forum held in October 2011. It is understood the first priority of the working group is to identify options for losses and how the Government would fund them. “We need to consider things like loss carry back, uplifting losses, and what happens to the value of losses when business change composition or ownership”, said Treasurer Wayne Swan. It is expected that the working group will deliver its initial report in November 2011 and a final report to the Government by March 2012, before the next budget.
Tax Office views on SMSFs, real property and borrowing rules
The Australian Tax Office (ATO) has recently issued a draft ruling which concerns self-managed superannuation funds (SMSFs), real property and the application of certain borrowing rules under the superannuation law. The draft ruling outlines where money borrowed under a limited recourse borrowing arrangement (LRBA) can be applied in maintaining or repairing (but not improving) a single acquirable asset.
TIP: While the draft ruling provides some welcome clarification on the ATO’s views on key aspects of the LRBA provisions, it only covers a few pieces of the LRBA puzzle. The rules can be complex and the penalties can be severe for getting it wrong. If you have any questions, please contact our office.
Tax law changes to tackle phoenix activities
The Government has recently introduced legislation in Parliament which aims to deter company directors from engaging in phoenix activities. Phoenix activities involve the deliberate liquidation of a company to avoid paying tax liabilities and employee superannuation. The business then “rises” again and continues operations controlled by the same person, but under another corporate entity and free of debts. The legislation also aims to encourage director compliance with tax and superannuation obligations.
The proposed tax law changes will make directors personally liable for their company’s failure to pay the employees’ superannuation guarantee amounts. The changes will also allow the ATO to pursue directors without issuing a “director penalty notice” where the company’s pay as you go (PAYG) withholding or superannuation guarantee liability remains unpaid and unreported three months after the due day. In addition, the Government proposes to deny directors (and their associates) entitlement to PAYG withholding credits (through the imposition of a new tax) where the company they are involved in has failed to remit PAYG withholding amounts.
TIP: It is proposed that the changes commence once the legislation is formally enacted. However, there are special transitional provisions which can cover amounts that are due to the ATO or a superannuation fund at the time the legislation enters into force. Directors should ensure their company’s tax risk management policies and systems are up-to-date. Please contact our office if you have any questions.
Small business depreciation rule changes on the horizon
The Government has sought comments on draft legislation which proposes to make various tax law changes concerning the small business depreciation rules that apply to small business entities. The changes are subject to the passage of the mining tax legislation as well as the carbon tax legislation in Parliament. However, should these taxes be successfully implemented, the proposed changes could improve cash flow and reduce compliance costs for small businesses. The proposed changes include increasing the instant asset write-off threshold from $1,000 to $6,500, and simplifying the current depreciation pooling arrangements to allow small businesses to depreciate some assets more quickly. The changes are proposed to apply from the
2012–2013 income year.
Standard deduction for work expenses next year
Public consultation has closed on the Government’s draft legislation which proposes to provide individual taxpayers with a standard tax deduction to cover work-related expenses and the cost of managing their tax affairs. The standard deduction proposed is $500 for 2012–2013, increasing to $1,000 for 2013–2014 and thereafter. Taxpayers whose claims exceed the proposed standard deduction will still be allowed to make those claims provided receipts are kept. However, the Government has noted the deduction is dependent on the implementation of the mining tax legislation (which is yet to be introduced).
Partnership not ended, so director still liable, says Court
A businessman has been unsuccessful in appealing to the NSW Court of Appeal against an earlier District Court decision which had held that, as a director of a company, he was liable to pay monies to the ATO that were withheld from employees’ wages. Under the tax law, a director of a company could face a tax penalty if amounts withheld from employee’s wages are not paid to the ATO.
Broadly, the director was part of a partnership operating a café/bar restaurant with another partner. However, the Court heard the relationship between the partners had deteriorated. The director argued the partnership had terminated, so therefore there could be no withholding by his company. However, the Court found it was the director’s involvement in the management of the partnership that had actually ended, not the partnership itself.
Dutch retiree took reasonable care, finds Tribunal
In a recent decision, the Administrative Appeals Tribunal held that a retiree had not failed to take reasonable care when he omitted foreign early retirement fund payments from the Netherlands from his 2003 to 2006 income tax returns. Among various factors, the Tribunal accepted the retiree’s evidence that he had sought and received oral advice from the ATO in 2002 which was contrary to later advice contained in a “private binding ruling” issue by the ATO in 2005. The Tribunal also took into account in making its findings that the retiree had limited English and did not understand and was confused by the ruling.
Super guarantee charge is a valid tax, says High Court
A market research company has been unsuccessful in its constitutional challenge in the High Court against the validity of the superannuation guarantee charge. The High Court had unanimously held the charge to be valid tax. In doing so, the High Court also affirmed an earlier Tribunal’s finding that market research interviewers were “employees” of the company for superannuation guarantee purposes, and not independent contractors.
 Posted in
Property Newsletter – October 2011
Investor Alert: Is it wise to put all your eggs in one basket?
Some investors are lucky enough to afford a fairly substantial investment property. Perhaps it’s a property around the $800,000 mark or even as high as $1 million. Whatever the exact figure, these investors are naturally excited at the prospect of being able to buy something a bit more glamorous than a run of the mill investment property. But the question is, is it better to put all your money towards this one property or spread it out across a number of cheaper properties?
Personally, I am a firm believer in buying multiple cheaper properties instead of one expensive property. The caveat to this however is that the cheaper properties must still be ‘investment grade’ properties, otherwise you negate any advantages in pursuing this strategy. Generally speaking for Perth, you will find most of these types of properties around the median house price of $400,000 – $500,000 (although that’s not to say that they don’t pop up occasionally below and above this mark). So in the earlier scenario, that could mean purchasing two properties instead of just the one.
There are a number of reasons why I support this strategy and most of them relate to risk.
Firstly, there’s less risk from rental vacancies. Should one property become vacant, the weekly income loss would be far less than if the same situation arose with your more expensive – and only – investment property. With multiple properties, you have a safety net in that your other properties will continue to bring in rental income while you find a replacement tenant for the vacant property. There’s no safety net, however, if your million-dollar investment sits vacant.
Secondly, having multiple properties is better from a liquidity point of view. Even if you invest with a buy and hold mentality, sometimes you may be forced to liquidate your assets despite your best laid plans. With multiple properties, you give yourself more options in that you may only need to sell off one or two assets and be able to retain others, keeping your foot in the market. With just one expensive investment property though, you may be forced to liquidate it and go back to the drawing board.
Thirdly, there’s protection if an area or property you choose doesn’t perform as well as expected or is negatively impacted by some activity or event. You will still have other properties in your portfolio that may continue to flourish which will help you in continuing to grow and leverage off your asset base. The economy is one such factor which can affect properties differently depending on their location and their value. In the economic climate of late, in Perth and throughout the nation, lower-to-mid priced properties have been far less affected than those in higher price brackets. If you had bought a single million-dollar investment property in Perth prior to the GFC, you would be in far more financial pain than if you had spread your funds across multiple median-priced properties.
Aside from risk, there are other reasons why multiple cheaper properties can be a better investment decision. At the median price, rental yields are typically quite good and superior to those achieved by higher value properties. With multiple properties, you also afford yourself more freedom to take greater calculated risks that could pay off handsomely, such as buying one property in an up-and-coming area or an area that could be rezoned. With just one substantially-valued investment property, however, you may be more reluctant to take that chance.
Diversification is important to any investor. Most think that diversification means to spread your money across different asset classes such as property and shares, but as you can see the concept equally applies within one asset class such as property. Buying multiple properties in different areas, in a price bracket that continues to attract demand and minimises your risk even in flatter economic times such as now, is wiser than putting all your eggs in one more expensive basket.
Land vs building – what’s the right balance?
Most people would be familiar with the phrase ‘land appreciates, buildings depreciate’. While this is a little simplistic, the statement generally holds true. It is surprising then how many investors, armed with this knowledge, still manage to get it wrong.
Real capital growth is derived from the appreciation of land. This is because land is a commodity that is in limited supply and always in demand. Buildings, however, lose value over time because the physical materials deteriorate and the appeal of their style and function diminishes as buyers’ tastes change.
Some people argue that the cost to build rises each year meaning replacement of the same building would cost more in today’s dollars, thus buildings appreciate. Yes, the cost to build increases with inflation but this is irrelevant. If you were to sell a once new property in 10 years, the fact is a buyer is buying the land with a 10 year old depreciated home on it – not buying land with a home on it valued at the replacement cost of building it today. That is why you find many old properties selling at practically land value. To think today’s costs are relevant is no different than trying to argue that your 10 year old Toyota Carolla is valued at the same price as the current year model! Having said all that, it is possible to retain some value in the building if you regularly maintain and update it. However, this obviously costs money and does not simply come about with time.
Many assume therefore that the message from all this is that the more land you have, the more capital growth you will be rewarded with. While there’s some truth here, this is where many investors tend to become unstuck. Let’s use an example to explain. Do you think the value of 500sqm of land in the heart of a major metropolitan city is the same as 500sqm of land in a small country town? Or even 1000sqm in the country town? Of course not.
Land is valued at a different rate per square meter depending on its location. Therefore the lesson is if you’re after strong capital growth, don’t base your buying decision on where you get the largest quantity of land for your money. Instead, focus on the proportion of value that the land component contributes to the overall purchase price of a property. This is what is sometimes called the land-to-asset ratio. Good purchases tend to be those that have a high land-to-asset ratio, that is, ones in which the land accounts for most of the property’s value. Although in many instances this directs investors towards older dilapidated houses in established areas close to the city, if you’re on a budget or need stronger rental income do not discount strata-title properties. If you do your homework and purchase carefully, you can find strata properties with a high land-to-asset ratio that perform just as well.
Tax Office set to change rules for SMSF investors
A new draft ruling released by the Australian Tax Office (ATO) has relaxed rules for those buying properties in their self-managed superannuation fund (SMSF).
Previously SMSF investors were allowed to maintain their properties but were restricted from making improvements to them. This stance had discouraged some investors from dabbling in property investment through their SMSF because of the strict regulations.
It is expected that this long-awaited change will have the most impact on cheaper properties in need of some TLC. These properties are now more appealing because SMSF investors would be able to conduct renovations to add value and improve the rental return.
While improvements are now permissible, they will only be able to be conducted if they are funded by cash resources in the SMSF and not borrowings. There are also restrictions on the types of improvements that can be made. Examples of allowable improvements include extensions and bigger kitchens, but the key is that improvements must not “fundamentally change” the property.
The ATO has also taken this opportunity to clarify other grey areas regarding property investment and SMSFs. They confirmed that unlike improvements, SMSFs may borrow funds to undertake repairs provided the repairs do not change the character of the dwelling.
Hot Property
Overview:
Looking for a high growth investment property in Perth, our clients enlisted the help of Momentum Wealth and its buyers’ agents to do the hard yards.
Given the client’s requirements, we immediately focused on the sometimes overlooked suburb of Craigie in the northern suburbs of Perth. Being a tightly held suburb (both for resale and rental) it tends to achieve good property price growth and also has the benefit of providing plenty of value-add opportunities.
When the right property came on the market, our buyers’ agents kicked into gear immediately. Being familiar with the area from a property investment point of view, we were instantly able to assess the potential and value of the property and place an offer. The property was ideal being an average 1970’s home (yet still achieving reasonable rent) and was situated on a flat corner block in a proposed rezoning area. We secured the investment property for our client within three days of it being listed beating other buyers to the punch.
Despite the competitive nature of securing properties in Craigie, Perth, we still managed to acquire the property under market value, but most importantly, secured an investment property for our client that has potential for great gains in future.
Result:
Purchase of a street front 3×1 brick and tile home in Craigie, 22km from Perth CBD.
Purchase price: $420,000
Estimated market value at time of purchase: $430,000
Savings: $10,000
Suburb Snapshot: Redcliffe
Redcliffe is an established suburb in Perth located approximately 10km east of the Perth CBD.
It’s situated near the suburbs of Belmont, Ascot and Cloverdale and enjoys excellent proximity to the city and airport, as well as being just minutes from the Swan River. The suburb is serviced by key transportation routes such as Great Eastern Highway, Tonkin Highway and the Graham Farmer Freeway, and is ideally located by short drive to commercial and industrial areas in Kewdale and Welshpool for employment. Redcliffe also has access to a variety of amenities such as local primary and high schools, parks, a cinema, and major shopping centre, Belmont Forum.
Over the past 10-15 years Redcliffe has undergone quite a transformation, with a number of developments changing what was once a suburb dominated by tired public housing into a desirable and well-maintained community. Popular estates such as ‘Flemington Chase’ and ‘Ascot Gardens’ were developed, and today much of the older parts are continuing to undergo rejuvenation with a few property development opportunities still available. Redcliffe tends to be popular with property investors, both for development opportunities as well as good rental yields (thanks in part to the consistent demand from fly-in fly-out workers who prefer a property close to the airport). It is also an area that is traditionally blue-collar; however with its proximity to the CBD and Swan River that is slowly changing with an increase in demand from young professionals and families.
Properties in Redcliffe generally fall into one of three categories – older undeveloped or partly renovated properties towards the northern end of the suburb (typically 50’s/60’s style on large land), newer strata-titled villas in the older northern end of the suburb (created from private subdivision), and newer homes and villas through the southern part built in the 90’s and 2000’s which are located in the developed estates.
Prices start from the low $300,000’s for small units and homes in less desired pockets. Between $350,000 – $400,000 are 3×1 properties on blocks under 500sqm (generally villas/units), while in the low $400,000’s are a mix of good size 3×2 properties and the occasional smaller 4×2 property. Most 4×2’s, depending on their location, age and land size, are generally priced from $450,000 – $550,000, as are older properties suitable for redevelopment. A handful of properties are found above $550,000 which include new and near new properties, larger homes, and larger development opportunities. Rents generally fall between $400 – $500 per week.
Key Statistics
| Growth rate (1 year average) | -0.6% |
| Growth rate (5 year average) | 6.1% |
| Growth rate (10 year average) | 10.9% |
| Population | 4,280 |
| Median age of residents | 34 |
| Median weekly household income | $975 |
| Percentage of rentals | 38% |
Source: REIWA.com.au, September 2011.
SPECIAL FEATURE: Momentum Wealth’s Rising Stars
You might think that after buying and selling around 13 properties, you’d be an old hand at property investing. Not so for this young couple which is why they reached out to Momentum Wealth to give them the help they needed.
Trisha Fulton and her husband Ryan have so far turned over more properties in their short lifetime than most people. However, it was always their principal residence that was the subject and not once had the idea of “property investment” entered their minds. Buying and selling was simply a result of their personal circumstances. In fact, due to Trisha’s job, she’s moved in and out of 65 company owned properties in the past 7 years.
When the young couple needed to relocate to Perth from Brisbane back in 2009, they spoke with buyers’ agent Ray Chua at Momentum Wealth to help them find the right home. Although things didn’t work out at the time, buyers’ agent Ray kept in touch and when it came time to take the plunge and buy an investment property in Perth, they knew exactly who to call.
Trisha and Ryan picked up the phone and enlisted the help of Ray and Momentum Wealth to give them guidance and help them make the right decision for their needs.
“Being our first investment property, there’s a different set of criteria than when you’re buying for your own home and you need to make a really intelligent decision based on returns and all that analytical information”, says Trisha.
“(Ray) opened up our minds to a lot of different opportunities that we probably wouldn’t have considered”.
The couple’s primary strategy is to buy properties with future development potential over a 7-10 year timeframe. With a strict 2 week deadline and other equally difficult criteria set by Trisha, Ray begun the search and located them a prime investment property in Rivervale, Perth in July this year. Purchased for $552,000, the property came with a shabby 2×1 property on a duplex sized block. However with buyers’ agent Ray’s insider knowledge and astute research, what really made the property special is its future potential.
“It’s got potential for a triplex development in the future. We wouldn’t have known these things without his help”, comments Trisha.
This determined pair are certainly not short of energy or ambition. With a number of goals set over the coming 10 years, the couple’s next plans are to acquire another 4 properties over the next 2 years across both Western Australia and Queensland. Once these properties double in value, they will start to subdivide and develop them. In 10 years time, they are hoping that they will be in position to not necessarily retire, but choose their work rather than be forced to work.
Although the couple started out as novice property investors, over the last 6 months Trisha has done a lot of her own research to educate herself about investing in property, and has had the help of a property advisor like Momentum Wealth. One piece of advice she decided to take on was to treat property investing as a business, not a hobby. Since starting their investment journey, she’s found this advice invaluable and highly recommends that other property investors do the same.
She also insists that in order to create this business mindset, investors need a good team of people to support them and that to get the most from them, you should treat them as you would expect to be treated yourself.
“If all the right people are in the right place and you look after them and they look after you, you’ve just simply got a good formula for success”.
Using Credit: Subsidy 2 – Low Level Borrowers
For many varied reasons, there will be many people in society who have no debt at all. Perhaps they are in their 50’s and have paid off their home and have no leveraged investments. There will also be people who have low levels of debt relative to their asset levels. There will be some people who have a relatively high level of debt compared to their asset levels. A bank or financial institution will have loans out to the entire spectrum of borrowers.
Assume a person owns their home worth approximately $500,000 and they have a loan of $50,000. What risk do you think the bank or financial institution is at of not getting their money back on this loan? Almost nil I’d suggest. If someone owned a property worth $500,000 and they had a loan of $250,000, what risk do you think they are to the bank or financial institution? Very little I would suggest. If they stopped the repayments the bank or financial institution has enough of an equity buffer in the secured asset that even in the event of a fire sale the property would have sufficient funds to cover the repayment of the loan.
If someone owned a property worth $500,000 and they had a loan of $400,000 what risk do you think they are to the bank or financial institution? There is some risk to the lender. If they stopped paying the loan and let the property go to ruin it is quite possible that the lender could lose some money. If you were lending money, wouldn’t you much prefer to lend to the person who owes $50,000 on the $500,000 home rather than the $400,000? Wouldn’t you be expecting a higher rate of interest on the higher level of borrowings to compensate for the extra risk?
While there is a larger risk to the lender by lending $400,000 versus $50,000 against a $500,000 asset, the financial institutions rarely charge different interest rates to different borrowers. The lender knows that across the board they will have a range of people at different levels of debt and in order to be able to offer a competitive interest rate they typically offer one interest rate across the board (except to high net worth borrowers who often get discounted interest rates). They know that if the economy went into a severe recession and property prices went down, there are enough borrowers who have low levels of borrowing that the lenders potential bad debts would not become too significant.
What do you think would happen if everyone borrowed up to 80% of the property value and kept it at that level? Suddenly the lenders would have a much riskier portfolio on their hands and they would have to increase interest rates to compensate for the risk. If the economy went into recession there is a chance that a high percentage of loans could go into default and the banks may lose significant amounts of money.
Those who borrow to a lower level relative to their assets should really be getting a cheaper interest rate than those who borrow to a higher level. Lenders have never been able to figure out a way to effectively price the different risk on property loans. They typically use the arbitrary figure of 80% loan to value as the point where loans become more risky. They don’t differentiate between 5% borrowings and 79%. Fortunately for highly leveraged borrowers, not everyone borrows to their maximum. Those who borrow to lower levels relative to their assets are effectively subsidising those borrowers who take higher risks and borrow towards the maximum.
Property Tax Tips: When are interest expenses deductible?
Generally interest is deductible if it is incurred when the borrowed money is used for income producing purposes. If the borrowed money is used for some or all private purposes then the interest on the private portion is non deductible.
For example, if you borrowed $300,000 from the bank and $200,000 was put into a property investment to generate income and the other $100,000 to purchase a home to live in, then 2/3rds of the interest would be deductible (being $200,000 / $300,000).
This is referred to as the “use” test or “tracing” test which generally means that:
(a) When borrowed money is used solely to purchase investment property then the interest will be deductible (while the property is rented or available for rent)
(b) Where borrowed money is partly used for investment purposes and partly for private purposes, the interest will be deductible to the extent it is used for investment purposes.
Many people believe that if they use an investment property as security for a loan than the interest on that loan is tax deductible regardless of what the money is used for. This can be a costly mistake. The deductibility of interest has nothing to do to with the security used to borrow the funds. You can use your own house, a car or a boat or anything. What matters is what the borrowed funds are used for.
Property Management: Case Study
Bianca started managing the properties and found the following:
Upon inspecting the properties, she discovered over $10,000 of urgent repairs that needed to be completed. She organised quotes, agreed on prices and negotiated payment plans with contractors. This meant the tenants were safe and the client could have all repairs completed at once without stress or financial strain.
Three of the leases had expired exposing the owner to the potential of an unexpected vacancy. New leases were signed with the tenants with the expiry dates staggered at different times in the year so no two properties would be vacant at once, protecting the owner’s cashflow in the event of a vacancy.
Four of the tenants were in arrears – one was 5 weeks behind. Bianca spoke with the tenants about their arrears and negotiated payment plans which has now led to all of the tenants paying their rent two weeks in advance.
Bianca has now spoken with the owner and his accountant and formulated a maintenance plan for the upkeep and refurbishment of all of the properties. This has given the client and his advisers a clear picture of when works are to be completed, what will be done and how much this is likely to cost.
Tax Newsletter – October 2011
Cash economy still on ATO’s radar
The ATO has maintained a focus on its compliance activities in relation to small business performance benchmarking and the cash economy. In a recent speech, the Commissioner of Taxation said businesses outside the relevant benchmarks are subject to ATO review and/or audit. Where businesses do not have adequate records to substantiate their performance, the Commissioner said the ATO will make a default assessment using the relevant small business benchmark.
The ATO uses a variety of tools to help it identify potential cash economy activities which include:
- collecting and comparing significant amounts of information from a number of sources, including banks, other government agencies such as Centrelink, and industry suppliers. The ATO can even collect information about purchases of major items such as cars and property; and
- comparing the performances of businesses against other similar businesses in the industry. The ATO currently has over 100 small business benchmarks for this purpose. The benchmarks are used to identify businesses that may be avoiding their tax obligations.
TIP: Undertaking a review of business records may help to identify whether you are at risk of review by the ATO. According to the ATO, taxpayers may be given concessional treatment in relation to penalties and interest, should they make a voluntary disclosure of a mistake.
Don’t take the bait on tax avoidance schemes
The ATO has recently identified a number of tax avoidance schemes which it says are a risk to small businesses. These include:
- complex arrangements involving trusts to provide loans to individuals;
- abusive labour hire schemes;
- claims by companies for a deduction for unpaid directors fees; and
- avoidance of fringe benefits tax.
TIP: Not all tax avoidance schemes are obvious and many can look legitimate. Only on close examination do higher risk features start to appear. Please contact our office if you have any questions.
Capital gains tax bills for failing test
The Administrative Appeals Tribunal has recently handed down two separate decisions concerning capital gains tax (CGT) concessions for small businesses. The tax law offers a range of tax concessions for small businesses that have made a capital gain on a “CGT asset” that has been used in the business. The concessions can reduce, eliminate or roll-over a capital gain. However, the concessions are only available if certain tests are met. The main issue before the Tribunal was whether the taxpayers satisfied the “maximum net asset value” test. The test would be satisfied if, just before the “CGT event”, the value of the assets of the taxpayers and their connected entities did not exceed $5 million.
Broadly, the Tribunal held the taxpayers did not meet the then “maximum net asset value” test in order to qualify for the concessions. The taxpayers did not satisfy the onus of proving that the “maximum net asset value” of the assets of the taxpayers and their connected entities were less than $5 million. In the first case, the Tribunal denied the taxpayer the concessions with respect to the sale of a marina for $8.9 million. In the second case, the Tribunal also refused the taxpayer the concessions in respect of a gain he made on selling two $1 shares in a company for $4.9 million.
TIP: There have been changes to the relevant rules. For example, the amount for the “maximum net asset value” test increased to $6 million. If you have any questions please contact our office.
Share trading business existed, says Tribunal
In an unusual decision, the Administrative Appeals Tribunal held a taxpayer was not a passive investor in relation to share trading activities and was carrying on a business of share trading for the year ended 30 June 2008. The taxpayer was a chief executive of a services company and traded shares in his own name on the share market. The Commissioner argued the taxpayer was not conducting a share trading business as he did not have a formal business plan and did not sell many shares during the relevant period. The taxpayer argued that the only reason he did not sell much of his portfolio during the period was due to the global financial crisis.
Taxpayer loses excess super contributions tax appeal
A taxpayer has been unsuccessful before the Federal Court in appealing against a decision of the Administrative Appeals Tribunal. The Tribunal had affirmed a superannuation excess non-concessional contributions tax assessment of $86,867 against her for breaching the $1 million non-concessional contributions cap during the transitional period to 30 June 2007 (which existed at the time). The taxpayer had argued that a $355,000 payment from her personal superannuation fund in June 2007 was received by her in a capacity as trustee before being on-paid to her new superannuation fund and therefore should be treated as a roll-over superannuation benefit. However, the Court broadly agreed with the findings made by the Tribunal.
TIP: As part of the 2011–2012 Budget, the Government proposed that eligible individuals be given a once-only option to have excess concessional contributions up to $10,000 refunded and assessed at their marginal tax rate for the financial year in which the contribution was made. The refund option is proposed to only apply for the first year in which the concessional contributions cap is breached, commencing from 2011–2012. If you have any questions please contact our office.
SMSFs warned on improper lending of money
The ATO says it is concerned that some self-managed superannuation fund (SMSF) trustees are lending money on favourable terms from their SMSFs to people who provide advice or assist in the running in the fund. It warns that this arrangement may lead to the loss of the complying status of the fund and concessional tax rates. The ATO says trustees should ensure that loan terms comply with the law and fit their investment strategy.
TIP: Decisions to lend money from an SMSF should be backed by the appropriate documentation such as an appropriate loan agreement. If you have any questions please contact our office.
Personal Properties Securities Act 2009 – possession really is 9/10s of the law!
If your business hires or leases equipment, sell gods on credit, provide goods on consignment, or finance receivables, then you need to be aware of the Personal Properties Securities Act 2009 (PPSA) being introduced on 1 February 2012 and how it will affect your business.
The PPSA is a national scheme recently introduced into Australia that seeks to replace the existing numerous state and federal registers with a single national register for all property securities (except land).
For more information you can view the act or simply google the many legal experts who have already commented on these introduced changes, aar is one example.
Corporate Newsletter – October 2011
Downside of excess cash
This article appeared in the October 2011 ASX Investor Update email newsletter.
Learn about the dangers of holding too much cash in Self-Managed Super Funds.
 By Robin Bowerman, Vanguard
Self-managed super funds (SMSFs) across Australia are manning the defensive portfolio parapets and their weapon of choice is cash. And this increase in cash holdings may be revealing considerably more than a simple lack of confidence in where the sharemarket is heading in the short term.
A recent research study by Vanguard/Investment Trends looking at the SMSF sector has shown that the so-called “wall of cash” in SMSFs has grown markedly as wary investors say they are waiting for the return of more favourable market conditions before reallocating funds to growth assets.
This may not be surprising but it is potentially a cause for concern if investors are trying to time markets rather than staying on course with a long-term asset allocation plan.
The nationwide survey of more than 3000 SMSF trustees shows that total cash and cash products held by SMSFs in Australia has grown by $40 billion since May 2009 to $113 billion in May 2011.
That is a dramatic increase in the headline numbers but the survey also identified the level of “excess cash” held by SMSFs – defined as funds that would normally have been invested in other investments/assets.
It is interesting that while overall cash holdings jumped significantly over the past couple of years, excess cash holdings have remained stable in terms of value at $39 billion, but now represents 35 per cent of SMSFs’ total cash holdings, down from 53 per cent in May 2009.
The research is suggesting that the role of cash within SMSF portfolios is undergoing a change in status, from parking place to permanent fixture.
The implications of this excess cash declining and overall cash levels rising may be that what investors once considered the “waiting to invest” portion of their portfolio has now been re-categorised to form part of the broader fixed-interest asset allocation. (Editor’s note: Do the ASX online interest rate securities course to learn more about the features, benefits and risks of fixed-interest products.)
That raises the bigger question of what is the role of fixed interest within a portfolio?
Potential risks
A larger cash allocation may appear an attractive option at the moment with bank term deposits providing rates of around 6 per cent per annum. US and European investors would look at those rates with envy.
However, over the long term, investors need to feel confident that their asset allocation is aligned to their risk/return profile and also their time horizon. Investors also need to understand the potential risks involved in having a portfolio that is overweight in cash.
Fixed interest is crucial to a well-diversified portfolio. In addition to providing regular income, it acts as a counterbalance to the inherent volatility of growth assets and also helps moderate a portfolio’s downside risk. The fixed-interest asset class also provides capital stability and lowers the variability of portfolio returns.
While these characteristics may sound a lot like term deposits, comparing the two side by side reveals some key differences, in particular, time and liquidity.
Beyond their initial similarities of regular income flow and limiting capital growth or loss, differences start to appear when we examine risk versus return. Cash has a low risk/return profile but is inherently short-term, at six to 12 months, whereas fixed interest offers a more medium risk/return profile with a typical investment horizon being three to five years.
An investor’s risk/return decision is heavily influenced by their time horizon. Cash in a term deposit usually requires a minimum timeframe of three, six or 12 months; fixed interest or bonds are more suited to those with at least a three-year outlook. So although a higher cash allocation may be appropriate for a retiree to cover a year or two of living expenses, for an investor with a decade or more to go to retirement, a broader exposure to fixed interest may be more appropriate.
Fixed-interest investing is also a lot broader than cash or term deposits and can span a wider risk spectrum. It could consist of highly defensive assets such as Australian or US government bonds, expand further to include semi-government bonds and supranational borrowers (i.e. The World Bank) or, moving along the credit risk curve, incorporate high-quality corporate bonds (think Toyota and BHP) all the way out to high-yielding so-called junk bonds.
The key point is that fixed-interest investing is broad; indeed, the fixed-interest markets globally are larger and more liquid than global sharemarkets. But in Australia our fixed-interest marketplace is relatively small, less visible and less understood – perhaps a positive, albeit unintended, consequence of having a Federal Government running budget surpluses for many years.
Indeed, one of the reasons SMSFs are retreating to term deposits as a quasi fixed-interest portfolio allocation – apart from the attractive short-term rates – is the lack of awareness and ability to access broader fixed-interest investments such as government bonds. Managed funds do offer broad fixed-interest products but they have not seen strong take-up among SMSFs.
SMSFs are often more likely to access investments directly. And while the Australian exchange-traded funds (ETFs) market in shares is growing strongly, fixed-interest ETFs are not yet able to be offered under the existing regulatory framework.
Benchmark portfolio
The asset allocation decision is most important for investors when it comes to their portfolio’s risk-and-return profile.
For anyone running their own SMSF, having a benchmark portfolio to measure yourself against can be a valuable, dispassionate tool. The Vanguard diversified funds are all index funds so they reflect market returns over the past eight years.
The portfolios range from conservative to high growth. In the conservative portfolio the cash allocation is 42 per cent while Australian and international fixed interest holdings are 11 per cent and 17 per cent respectively, giving a total allocation to income assets of 70 per cent. By contrast, the balanced portfolio has 50 per cent in cash and fixed interest, and 50 per cent in growth assets.
Another key consideration for someone running their own SMSF is the need to rebalance the portfolio. Periods of volatility can change the allocations, so it is important to monitor and rebalance periodically to keep the same risk profile.
The harsh reality is, being under or over-invested in different asset classes at the wrong time can have a significant impact on an investor’s return. Getting market timing right is an extremely difficult task that can often leave investable funds on the sidelines during periods of strong returns.
History has shown that allowing emotions to drive investment decisions – be it overconfidence in rising markets or fear in falling markets – rarely serves investors well; and that over the long term, investors have traditionally been rewarded for showing patience and discipline around their investment strategy and diligence in rebalancing portfolios back to target asset allocations.
No one can be certain of what sort of volatility to expect from markets. However, we do know that previous periods of excess volatility have clustered around global macro events; and that during those periods, well-diversified portfolios that included allocations to less risky assets such as fixed interest and/or cash tended to ride out the storm much more smoothly.
So, while times like these can be unsettling for investors, those who have determined an appropriate asset allocation and who rebalance as necessary, are in a better position to weather periods of uncertainty, as well as the inevitable market dislocations to come.
About the author
Robin Bowerman is Head of Corporate Affairs and Market Development at index fund manager Vanguard Investments Australia.
From ASX
The ASX ETF course has seven modules covering the fundamentals of what ETFs are and how to buy and sell them. Subsequent modules take a detailed look at particular types of ETFs, including a case study.
The modules are self-directed, meaning you can work through them sequentially or go from, say, domestic ETFs to international ETFs or exchange-traded commodities (ETCs). Each has summary slides and a quiz to help you be confident you have grasped the concepts.
Best of all, you can do the online course when and where you like, at your own pace, and print the notes. All you need is an internet connection and computer.
Blue-chip income stocks
This article appeared in the October 2011 ASX Investor Update email newsletter.
What the charts say about fully franked shares that yield at least 10%.
 By Alan Hull, author
How does someone get their hands on double-digit returns in such a weak sharemarket? Until late 2007 it was as easy as falling off a log with the Australian sharemarket powering along at well in excess of 10 per cent annually. Below is a chart of the All Ordinaries index showing the market’s meteoric rise from early 2003 to late 2007.
All Ordinarires Index chart – 2000 to 2011
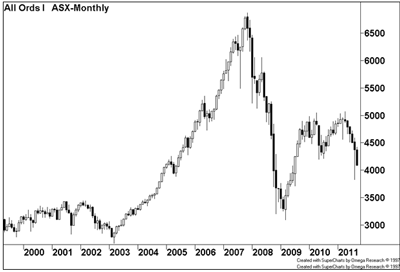
Alas, these good times are behind us and the Australian sharemarket has been in the doldrums since 2008. In fact it is currently forming a major low, which can be seen in the following chart of the All Ords that goes back to the 1987 crash.
All Ords chart trendline – 1987 to 2010
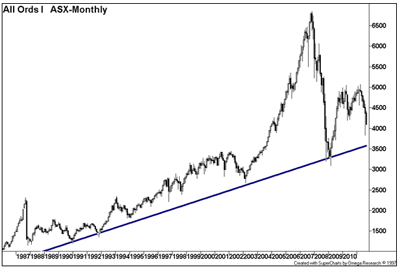
The chart above shows how the market is trending downwards and that there is still, potentially, a little distance to go before we hit the long-term trendline.
I would hope this trendline provides some support, but it is actually more than 10 per cent away from where the market is trading at the time of writing. So if you were thinking of buying shares right now in the hope of realising some capital growth in the near future, I would think again. There is a danger of our market falling further in the short term.
Warren Buffett would probably be happy
In my view, this is not a time to be buying shares for capital growth but rather a time to be focusing on income shares that pay reliable dividend yields. In other words, this is Warren Buffett’s time and that is why we have been hearing and seeing so much of him in the financial news. Is it possible that, like him, we too can find shares yielding double-digit returns? The short answer is yes.
What is more, most of these high-yielding shares are to be found in the top 25 ASX-listed companies, based on market capitalisation at the time of writing. I’m not declaring that Buffett would be happy with the fundamentals of these companies, but he certainly has demonstrated through his own investment choices that he would be happy with their yields.
Let’s take a closer look at these high-yielding blue chips, starting with the Big Four banks. (Editor’s note: For a fundamental view on banks stocks, read the article by Clime’s Matthew Koroi in this issue.) I don’t think it is necessary, or helpful, to analyse them separately for the purpose of this exercise, so I’ll list their vital statistics together).
| Code | Price | Div. yield | Franking |
|---|---|---|---|
| ANZ | $19.32 | 7.14% | 100% |
| CBA | $45.11 | 7.09% | 100% |
| NAB | $22.48 | 7.21% | 100% |
| WBC | $19.31 | 7.77% | 100% |
I have included franking (tax credits) because this must be taken into consideration when working out the true yield of these shares. For all the Big Four, the franking is 100 per cent, which means the banks have paid the full amount of company tax owing (at 30¢ in the dollar) on 100 per cent of their earnings.
To encourage investment in shares, the Federal Government many years ago decided that the tax paid by companies could be passed on to investors in the form of tax credits. So not only does ANZ Bank pay out an annual dividend yield of 7.14 per cent (at the time of writing) but it also comes with a tax credit of 30¢ in the dollar.
To compare apples with apples when it comes to dividend yields, it is necessary to “reverse out” the tax credits. In the case of 100 per cent franking this is achieved by simply dividing the dividend yield by 0.7.
Therefore ANZ’s grossed-up dividend yield = 7.14%/0.7 = 10.2%
And bingo, ANZ is yielding just over 10 per cent per annum when we take the tax credit into account. In fact, any dividend yield equal to or greater than 7 per cent that comes with a tax credit of 100 per cent will gross up to 10 per cent or more. Hence, all the Big Four banks at the time of writing are yielding just over 10 per cent per annum when their franking credits are taken into account.
I will include a small caveat here, because not everyone can make full use of the tax credits received because they do not pay that much tax in the first place. This is particularly relevant to superannuation funds, where the tax being paid can often be very low and in many cases is well below 30¢ in the dollar. To find out if you can make full use tax credits, speak to your accountant and/or financial planner.
I should mention that the forward projections by the Big Four are for an increase in their dividend payments over the next couple of years. I am fairly comfortable with the idea of buying and holding their shares for the long term, given that the banks’ long-term future prospects are generally very good, in my opinion. Our banks seem to have mastered the ability to prosper in both good times and bad, if the GFC is anything to go by.
If we take ANZ’s share price to be reasonably indicative of all of the Big Four, which I believe it is, then we can employ it as a sort of charting proxy for this group. The following chart shows ANZ (red line) overlayed with the All Ordinaries index (black line), demonstrating how similar the behaviour of the four banks has been to the All Ords over the past 10 years.
ANZ bank chart overlaid with All Ords – 2001 to 2011
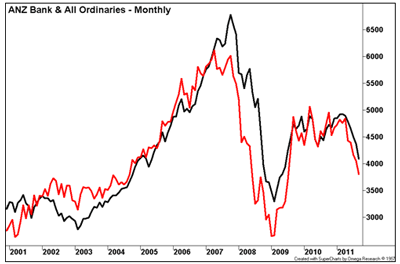
This is important, because it suggests the four banks will probably recover along with the broader share market. I’m not sure when that will happen, but it will. Therefore I believe these banks are currently an attractive proposition as income shares and their prices will ultimately recover from their current lows.
Telstra
I’m not so sure about Telstra, another stock in the top 25, even though it is currently yielding a very attractive 9.33 per cent plus 100 per cent tax credits: a grossed-up dividend yield of 13.33 per cent.
Telstra monthly chart – 2000 to 2011
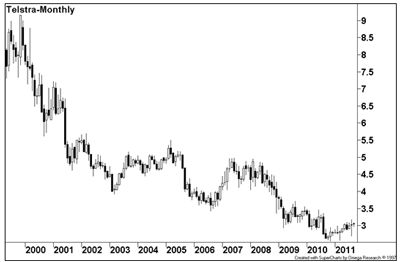
Investors have moved away from Telstra shares over time; a very attractive dividend yield has been offset by a falling share price.
QBE Insurance
To the last share in the top 25 that is yielding double-digit returns, QBE, which has a grossed-up dividend yield of 10.15 per cent annually. But again, here is another share price that has been constantly on the decline for the past several years and therefore it has me a bit spooked as well.
QBE monthly chart – 2006 to 2011
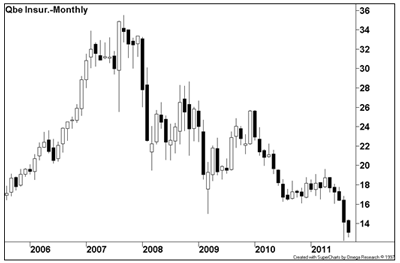
What is the point in chasing high yields if they are just going to be gobbled up by a constantly falling share price? Mind you, I don’t think QBE is in the same boat as Telstra in terms of its business model, but right now its share price is clearly in a very well-established downtrend.
I would be inclined to wait for signs of a reversal in QBE’s long-term downtrend and then take another look at it. Hence, even when assessing and acquiring income shares, I still bring every skill I have to the table: fundamental and technical analysis, an understanding of the broader economy, and my business acumen.
About the author
Alan Hull is a share trader, fund manager and author of the investment books Blue Chip Investing and Active Investing-A Complete Answer. More information is available at www.alanhull.com.au. To request a copy of his PDF chapters on how to identify and manage asset class shares (income), emails to enquiries@alanhull.com
From ASX
The ASX website has a wealth of free education material on charting. Visit the ASX Charting Library for stories that suit beginners through to advanced technical analysts.
The views, opinions or recommendations of the author in this article are solely those of the author and do not in any way reflect the views, opinions, recommendations, of ASX Limited ABN 98 008 624 691 and its related bodies corporate (“ASX”). ASX makes no representation or warranty with respect to the accuracy, completeness or currency of the content. The content is for educational purposes only and does not constitute financial advice. Independent advice should be obtained from an Australian financial services licensee before making investment decisions. To the extent permitted by law, ASX excludes all liability for any loss or damage arising in any way including by way of negligence.
Big banks offer value
This article appeared in the October 2011 ASX Investor Update email newsletter.
See why Clime believes the Big Four are trading at a discount to intrinsic value.
 By Matthew Koroi, Clime
Although banks earn revenue in many ways, their main income comes by lending money at a higher rate than they pay for money deposited with them. This is referred to as the net interest margin. Over the past 15 years, banks have placed more emphasis on non-interest income, such as fees, to increase their profits, and today non-interest income represents between 30 per cent and 40 per cent of the major banks’ total revenue.
When analysing a bank, five financial metrics often referred to are:
- Return on equity: Clime likes to see a bank achieving a standard ROE of around 20 per cent.
- Return on assets: We like to see a bank achieving ROA of approximately 1 per cent.
- Cost-to-income ratio: A figure we would like to see declining over time and trending towards 40 per cent of net revenue.
- Net interest margin: The difference between average interest cost and average interest earned.
- Asset growth and a reduction in impaired assets (assets that have to be written down).
In determining the business risk of a bank, Clime focuses on five areas:
- Liability risk: The risk of depositors’ requests for withdrawals being in excess of a bank’s available cash. This is well regulated by the Australian Prudential Regulation Authority, which monitors banks’ capital adequacy and liquidity.
- Credit risk: The chance that those who owe money to the bank will not repay it.
- Interest rate risk: “Margin squeeze”, the situation where rising interest rates force a bank to pay more on its deposits than it receives on its loans.
- Derivative books: In the modern banking world, banks earn revenue from derivative books and proprietary trading. This is a higher-risk way to generate returns, and an example of when things can go wrong was highlighted in 2003 when National Australia Bank lost about $360 million in a foreign exchange “rogue trading” incident.
- Credit growth: Savings rates in Australia are the highest they have been in 15 years and credit growth across all sectors – housing, business and personal – continues to fall. The combination of this reflects growing conservatism since the GFC. Although this is a negative for banks’ shareholders, when credit demand picks up it will result in more loans being written and will drive up net income. This should lead to improved profits and profitability.
Investing for yield
Given the volatility of financial markets over the past four years, many retail investors perceive a higher level of risk in the sharemarket. Reserve Bank data shows the percentage of total household assets being allocated to the sharemarket is the lowest it has been since the early 1990s, at around 4 per cent.
If you look through the current share price action of banks, with a long-term focus on wealth creation, the recent market volatility need not turn you off shares. By identifying profitable businesses that reward shareholders with consistent and sustainable dividends, you are able to ensure a steady income stream despite erratic short-term price movements.
In a general sense, when analysing companies for yield, Clime tends to find the best businesses display the following five characteristics:
- Dividends are consistent and sustainable
- Dividends are franked
- Dividends are paid from the business earnings and supported by real cash flows, not recent capital raisings
- Yield is in excess of 6 per cent
- The business has a record of growth in dividends per share.
In relating these characteristics to the banks, we can tick off each one of them.
Over the past two decades the average dividend yield of the Big Four banks has been roughly 5.8 per cent.
At an average of 7.5 per cent (based on prices at September 20, 2011), the yield currently available on the Big Four banks is high in a historical context. Including the benefit of franking, this figure is around 10.7 per cent.
The yield available on bank shares is also attractive in a relative sense when compared to other asset classes, such as interest-bearing bank accounts and investment property.
Using Clime data, the following tables compare a range of financial figures of the various types of banks in Australia.
The majors
| Bank | Market Cap* | FY11 ROE | FY11 ROA | FY11 net interest margin | Grossed up yield (for franking credits)* |
|---|---|---|---|---|---|
| ANZ^ | $50.8bn | 14.74% | 0.95% | 2.51% | 10.00% |
| CBA | $68.7bn | 18.60% | 1.02% | 2.11% | 9.70% |
| NAB^ | $48.4bn | 11.76% | 0.67% | 2.40% | 10.30% |
| WBC^ | $58.3bn | 15.42% | 0.95% | 2.15% | 11.00% |
* Current at close Sept 20, 2011
^ FY2010Regional banks
| Bank | Market Cap* | FY11 ROE | FY11 ROA | FY11 net interest margin | Grossed up yield |
|---|---|---|---|---|---|
| BEN | $2.9bn | 8.73% | 0.63% | 1.78% | 10.5% |
| BOQ^ | $1.5bn | 8.56% | 0.53% | 1.49% | 11.1% |
* Current at close Sept 20, 2011
^ FY2010Investment banks
| Bank | Market Cap* | FY11 ROE | FY11 ROA | FY11 net interest margin | Grossed up yield |
|---|---|---|---|---|---|
| MQG | $7.4bn | 8.41% | 0.613% | 1.15% | 8.7% |
* Current at close Sept 20, 2011(Editor’s note: Do not read the commentary as share recommendations. Do further research of your own or talk to your financial adviser before acting on themes in this article).
From our perspective, the majors are the safest and best performing of Australian listed banks, with each displaying stronger balance sheets, return on equity, return on assets and net interest margins. To whittle that list down further, Clime’s favoured banks are CBA and ANZ.
The Asian growth strategy of ANZ is positive from an investment perspective, because Asia offers the best economic growth profile globally at present (although not without higher risk and potential capital raisings for acquisitions). The recent financial performance of CBA is excellent and its strong metrics and clear strategy suggest it is the best-performing locally focused bank.
Westpac is interesting and may surprise, with increasing synergies from the St George acquisition driving further cost reductions, a multi-branded strategy with a high-quality lending book, and potential wealth-management leverage should equity markets remain sound.
A further indication of the strength of Australian banks is that of the 10 AA-rated banks in the world, Australia’s Big Four are all represented. Only one bank in the world, Rabobank, is rated AAA. This is not to say there is absolutely no chance of the big Australian banks ever failing, but it does mean the risk is somewhat lower in a relative sense.
Investing in shares always carries higher risk than investing in other asset classes such as property or interest-bearing securities. The trade-off, however, is the potential for higher returns. By investing in Australian banks at current levels with a longer-term view, not only are investors able to achieve above-average yields but they are leveraged to the future growth of the economy when favorable business conditions return.
At the time of writing this report, Clime finds each of the Big Four banks to be trading at discounts to their intrinsic value.
About the author
Matthew Koroi is a senior analyst at Clime Asset Management.
From ASX
Use the Search Dividends function on the ASX website to find dividend information.
Boring is beautiful
This article appeared in the October 2011 ASX Investor Update email newsletter.
Why reliable, higher-yielding utility stocks appeal in volatile markets.
 By Nathan Bell, Intelligent Investor
Europe, we are told, is on the brink of financial disaster. The brink happens to be a crowded place right now, with America and Japan nestled comfortably on the same precipice. With markets swinging wildly, utility and essential infrastructure investments have seldom been more attractive.
Whether its gas pipelines, electricity networks, toll roads, airports, or power stations, a combination of monopolistic assets, regulated returns and stable cash flows are supposed to offer conservatism and stability. An antidote, in other words, to the chaos. However, like most conventional wisdom, those truths need to be tested.
The good and the bad
Because of deregulation, a distinction has emerged between what constitutes a utility, such as energy giants AGL and Origin Energy, and what are more accurately termed essential infrastructure businesses, such as Spark Infrastructure and SP AusNet. But what you really need to know is that both categories have attractive characteristics; many assets are natural monopolies so they face limited competition. It only makes sense, for example, to build one set of pipelines and power grids. Cash flows are predictable, too.
These companies own a mix of regulated and unregulated assets. Spark Infrastructure and SP AusNet operate the “poles and wires” of the electricity grid – a natural monopoly. Because their prices are regulated and there is no competitive pressure, returns are predictable and stable. A large lick of debt in such instances is bearable. Origin Energy and AGL, however, are retailers of electricity, an unregulated activity subject to fierce competition. Too much debt in this scenario could be dangerous.
In the past, Intelligent Investor has been wary of the utility sector because of its excessive debt and unsustainable dividends. These remain key areas of concern, although predictable cash flows mean infrastructure assets can often carry higher-than-average levels of debt. Investors need to be judicious in deciding when debt is OK and when it’s not.
Dividends also deserve attention; higher is not necessarily better. It is important to measure dividends paid against cash the business generates. Energy and infrastructure assets have a habit of generating profits without generating cash. This neat trick is done by revaluing assets as a profit, an activity that does not add to the business cash pile. Be sure to check cash flow and profits to see if one is turning into the other.
A dividend that is too high could also signal a future capital raising. Take Spark and SP AusNet as an example. Both need to reinvest in their distribution networks to increase regulated returns, so require heavy doses of cash. Spark pays only about half its cash flow as dividends, leaving cash to reinvest. Spark’s dividends may be lower than SP AusNet’s, but they are also more sustainable and will grow, in Intelligent Investor’s opinion.
Three of the best
(Editor’s note: Do not read the following ideas as share recommendations. Do further research of your own or talk to your financial adviser before acting on themes in this article.)
Selecting the business in which to invest is the next step. Predictable cash flows and high yields have traditionally attracted income investors to infrastructure companies. There are, however, some utility and infrastructure businesses that can potentially grow, too. Spark Infrastructure, MAp Group and Origin Energy fall into this category, according to Intelligent Investor’s research.
1. Origin Energy
Origin operates in the non-regulated parts of the electricity sector. Although retail prices are regulated, there is a twist. Regulatory bodies, such as IPART in NSW, set the maximum price that retailers such as Origin and AGL can charge customers. But in urban markets, for example, where the cost of supply is low, price competition means Origin can fight for customers and charge less than the regulated tariff, yet earn higher returns than most regulated businesses.
Origin’s real competitive advantage, though, lies in an area where there is no regulation at all: power generation. Under the intelligent stewardship of chief executive Grant King, who realised early that energy assets would become more valuable; Origin assembled some of the biggest and best gas and electricity generation assets in the industry at a fraction of what they would cost today. With a massive pool of cheap production and generation capacity, price regulation is not a big deal. Origin’s growth has come not from the largely regulated price at which it sells energy, but from the low costs of producing it. As a low-cost producer of power, it is well placed to compete aggressively.
Although the largest portion of profits comes from retailing energy, Origin also has a significant oil and gas production business that it intends to grow. A large coal seam gas-to-LNG project in Queensland could well transform the company, making the production side of the business far more important. Although Origin is morphing into more than a simple utility, its prospects are attractive.
2. Spark Infrastructure
Spark owns essential infrastructure and charges other companies a fee to access it. The business model appears simple enough but understanding what fees the companies are allowed to charge is more complicated.
Spark owns stakes in energy distributors ETSA, Powercor and Citipower, which have monopoly control over the electricity network in their respective geographic regions. As a result, the government-sanctioned Australian Energy Regulator (AER) controls how much they can charge their customers. Crucially, the return Spark is allowed to earn depends on how valuable its asset base is, which is determined by the value of its assets in the prior year, less depreciation plus fresh capital expenditures. The more money Spark spends on capital expenditure, the more the regulator allows it to earn.
Because Spark is in the midst of a major expenditure cycle (which, incidentally, is the reason everyone’s electricity bills are rising), returns from the three underlying assets are forecast to grow 8 per cent a year over the next four years. And thanks to the diligent use of debt, Spark’s interest in those assets will increase by 14 per cent a year over that time. A reasonable yield of more than 7 per cent (unfranked) will continue to be paid, but with plenty of cash to fund expenditure, Spark is one infrastructure business with genuine growth prospects.
3. MAp Group
MAp Group is not an energy utility, but it will own 85 per cent of Sydney Airport and, if you have used it, you will instantly understand why airports make wonderful businesses. Park your car in the one of the most expensive airport parking lots in the world, and then venture into the terminal itself and you notice that Sydney Airport has been transformed into a mini-Westfield, complete with captive shoppers and lucrative rents. From parking charges to rents and aircraft charges, Sydney Airport is a fee-fest. As a customer, it’s annoying. As an investor, it’s a goldmine; the closest thing to an unregulated monopoly.
MAp is in the happy position of being able to charge what it likes for most of its services and not having to worry about competition. But having so much power also brings risk. If MAp gouges profits too fiercely, the risk of government intervention and reregulation is ever present. The company runs a fine balance between maximising returns without putting off regulators.
The company will soon pay a special distribution of 80¢ per security, and generally offers a distribution yield of about 6 per cent. Although MAp is an attractive business, it is exposed to some specific risks; any event that would severely cut travel volumes through Sydney Airport, such as industrial action, or a weather or health scare, would have a big impact. Keep this in mind when allocating capital.
Utility and essential infrastructure companies such as these may seem a little boring but many investors will happily welcome a little less excitement right now.
About the author
Nathan Bell is research director of Intelligent Investor. Access a free trial.
From ASX
ASX Infrastructure Funds has information on the features, benefits and risks of investing in listed infrastructure funds.
The views, opinions or recommendations of the author in this article are solely those of the author and do not in any way reflect the views, opinions, recommendations, of ASX Limited ABN 98 008 624 691 and its related bodies corporate (“ASX”). ASX makes no representation or warranty with respect to the accuracy, completeness or currency of the content. The content is for educational purposes only and does not constitute financial advice. Independent advice should be obtained from an Australian financial services licensee before making investment decisions. To the extent permitted by law, ASX excludes all liability for any loss or damage arising in any way including by way of negligence.
© Copyright 2011 ASX Limited ABN 98 008 624 691. All rights reserved 2011.
Finance Newsletter – October 2011
Mercia’s Mortgage Brokers
Have you checked your home or investment loan recently?
Rates are all over the place, as the jury is out re the future economic direction.
Want to save interest, how about fixing your rate?
We have a fixed rate of 6.33% for 1 or 3 years. That’s got to be less than you are paying now, and you won’t have to worry about any future increases.
If you don’t want to fix your rate, the answer may be to find a low variable rate. What’s your current variable rate?
Current variable rates are as low as 6.80%. This is not a honeymoon rate for a year or so, it’s discounted for the life of the loan. There are great deals available if you know where to look.
We may be able to find you a better rate at your existing bank, and if not we can do the paperwork to refinance you to a better deal. Some banks are currently offering to pay your fees to switch banks. A broker can show you exactly how much you can save and do the paperwork for you.
If you or anyone you know are suffering “mortgage stress” do something about it now!
If a borrower gets behind or is late with a payment the options to restructure/refinance and ask for help are diminished. Don’t be afraid to ask for help.
Call Dan Goodridge on 0414 423 340 or or e-mail dg@iinet.net.au at Mercia Finance if you require any type of finance information.